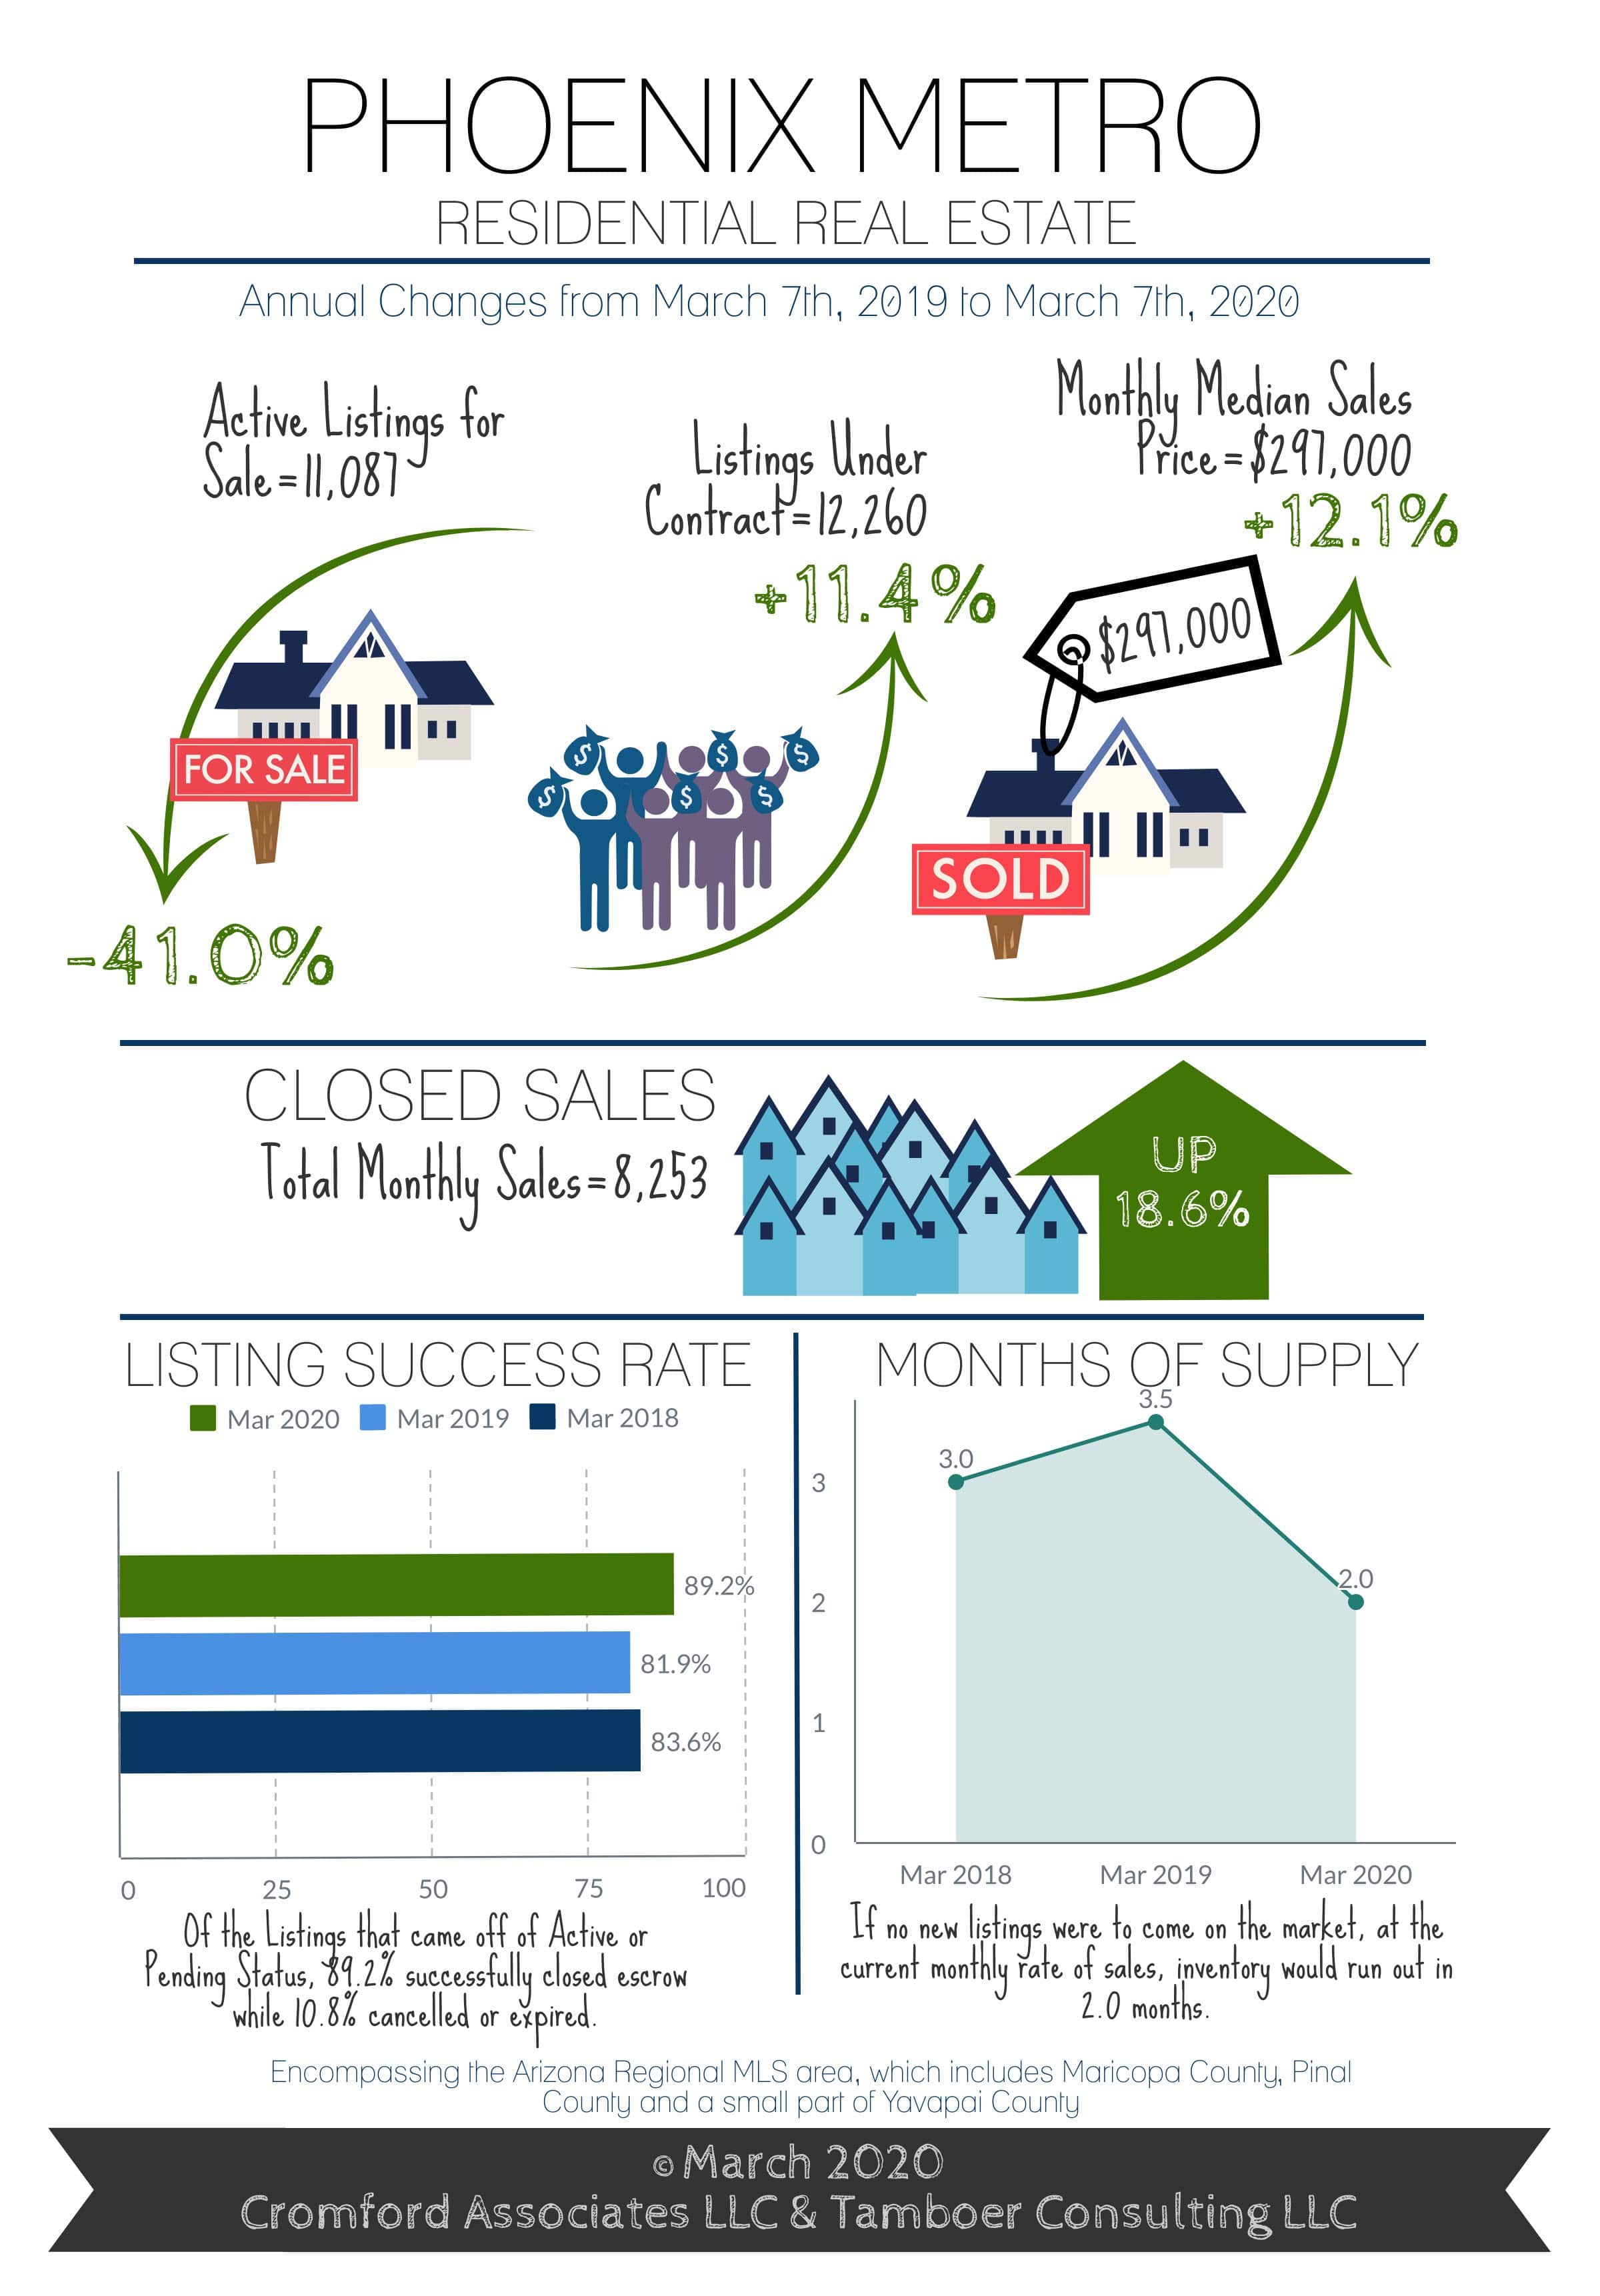
Officially a Frenzy: 11% More Contracts Than Listings For Sale
Contracts Over $1M up 60% Over Last Year

Market Summary for the Beginning of March
The supply situation is even more extreme than last month. Rapidly rising prices have done little to dampen demand.
Here are the basics – the ARMLS numbers for March 1, 2020 compared with March 1, 2019 for all areas & types:
- Active Listings: 11,003 versus 18,959 last year – down 42.0% – and down 8.1% from 11,974 last month
- Under Contract Listings: 11,988 versus 10,357 last year – up 15.7% – and up 19.5% from 10,030 last month
- Monthly Sales: 7,450 versus 6,522 last year – up 14.2% – and up 15.3% from 6,461 last month
- Monthly Average Sales Price per Sq. Ft.: $185.11 versus $168.65 last year – up 9.8% – and up 1.6% from $182.20 last month
- Monthly Median Sales Price: $295,000 versus $264,000 last year – up 11.7% – and up 1.8% from $289,900 last month
The supply of active listings without a contract is down 42%, making life extremely difficult for buyers. New listings are still arriving more slowly than normal and year-to-date we have experienced a shortfall of 10% compared to 2019. Supply continues to fall quickly across most of the market with only the 55+ areas and the very high end maintaining a steady supply of active listings, albeit below normal.
New homes are increasing their share of the market but most of them are not listed on ARMLS so do not feature in the above numbers. New homes are covered more completely in the Cromford Public section of this site where the numbers are based on county recordings.
Higher prices are supposed to suppress demand, but they have not risen nearly enough to have any effect so far. Over the past month the Cromford® Demand Index has risen from 102.8 to 106.7. At the same time the Cromford® Supply Index has dropped from 47.7 to 45.8.
Rising demand and falling supply will inevitably lead to higher prices over the next few months.
For Buyers:
Not even the COVID-19 coronavirus can slow down the Greater Phoenix housing market. For every 100 active listings in the Arizona Regional MLS there are 111 that are already under contract. Greater Phoenix is officially a frenzy and it’s only March. We can expect to see this continue at least through May without relief as buyer demand is typically highest in the Spring.
It’s even more dramatic in the Southeast Valley, West Valley and North Phoenix and all areas where prices land between $175K-$300K. For a stark example, on March 7th in Glendale there were 3 properties for sale between $175K-$200K and 25 under contract. In Chandler there were 3 properties active between $200K-$250K and 37 under contract. In the North Phoenix Moon Valley area there were 8 properties for sale between $250K-$300K and 30 under contract.
There is a reason why people continue to pounce on what’s available for sale. The average price for a 1,500-2,000sf home is now $331K and continues to rise. That may seem alarming considering it was $324K at the peak in 2006, but contrary to popular belief it’s more affordable today because of the interest rates. In April 2006, with an average of 6.51% the monthly principal and interest payment on a 30-year fixed loan with 10% down was $1,854. Today at an average of 3.45% the same home is $1,331, a savings of $523. More recently, over the last 16 months despite prices having risen 9.4% for median-sized homes the monthly payment dropped by approximately $112/month.
For Sellers:
There’s not much more to say to sellers under $500k, frankly their homes may be sold before we’re done saying it. The stark gap between supply and demand doesn’t ease up until budgets go over $600K. Sellers in areas such as North Scottsdale, Paradise Valley, the Camelback Corridor and Downtown Phoenix still have plenty of competition to contend with, but well-priced, updated, move-in ready homes will still see heightened buyer interest.
The luxury market is doing exceptionally well, however sellers should not expect the stampedes seen in the rest of the market. There are 522 properties under contract over $1M, up a whopping 60% over last year at this time. However there are still 1,657 competing properties for sale in this price range and those that sold in February averaged 5-6 months on the market.
©2020 Cromford Associates LLC and Tamboer Consulting LLC


