Latest Market Summary from the Cromford Report
July behaved according to expectations, in most ways it was similar to July 2012, but is a few ways very different.
Here are the basic ARMLS numbers for August 1, 2013 relative to August 1, 2012 for all areas & types:
- Active Listings (excluding UCB): 16,456 versus 13,403 last year – up 22.8% – and up 4.9% from 15,692 last month
- Active Listings (including UCB): 19,779 versus 20,085 last year – down 1.5% – but up 1.6% compared with 19,463 last month
- Pending Listings: 7,755 versus 10,412 last year – down 25.5% – and down 12.8% from 8,892 last month
- Under Contract Listings (including Pending & UCB): 11,078 versus 17,094 last year – down 35.2% – and down 12.5% from 12,663 last month
- Monthly Sales: 8,108 versus 7,208 last year – up 12.5% – and down 1.9% from 8,263 last month
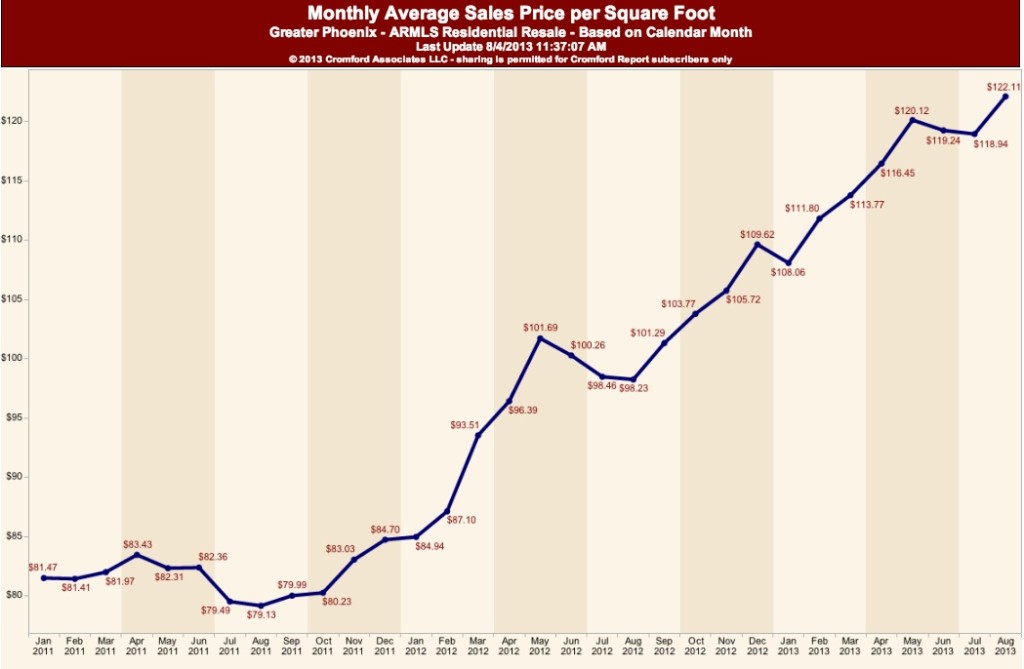
- Monthly Average Sales Price per Sq. Ft.: $118.88 versus $98.55 last year – up 20.6% – but down 0.4% from $119.29 last month
- Monthly Median Sales Price: $185,000 versus $145,000 last year – up 26.9% – and up 2.2% from $180,000 last month
Sales volume in July was fairly strong, up 12.5% from a year ago. However the number of listings under contract has fallen precipitously. This fall gives the impression that imminent future demand has fallen dramatically. However this fall can really be attributed to the huge drop in short sales and pre-foreclosure in escrow – there were 3,558 short sales and pre-foreclosures under contract on August 1, 2013 and 10,569 on August 1, 2012. This is a 66% decline. In fact the 7,011 drop in short sale and pre-foreclosure listings under contract exceeds the drop in overall listings under contract (6,016).
If we look at the breakdown of under contract listings we find the following:
| Under Contract Counts | August 1, 2012 | August 1, 2013 | Change % |
| Normal | 4,990 | 6,546 | +31.2% |
| REO | 957 | 545 | -43.1% |
| Short Sales & Pre-foreclosures | 10,569 | 3,558 | -66.3% |
| HUD | 578 | 429 | -25.8% |
| All excluding Short Sales & Pre-foreclosures | 6,525 | 7,520 | +15.2% |
If we ignore the UCB listings and focus on pending listings, we see a drop of 2,657. Again this can entirely be accounted for by examining the short sales and pre-foreclosures which have declined by 2,751 or 41% between August 1, 2012 and August 1, 2013.
We conclude that overall demand has fallen just a little, probably due to a combination of higher prices and higher mortgage interest rates, but this is not really affecting demand for normal listings. However it is certainly affecting the key demand measurements, such as the Contract Ratio and Cromford Demand Index™. These measurements make no distinction between transaction types and the rapid disappearance of short sales and pre-foreclosures from the market is giving us an artificially large negative signal on demand. We would wait until the number of short sales and pre-foreclosures stabilizes before concluding that demand is really going soft.
Though higher than July last year and in June 2010, we saw more sales in July 2009 and 2011. However in those years we had a lot more bank owned homes available. If we take out the 150 out of territory sales, we are left with 7,958 which can be split up as follows:
- 178 were HUD sales
- 487 were REO sales
- 1,061 were short sales or pre-foreclosures
- 6,232 were normal sales
This is a similar mix to June 2013 but dramatically different from July 2012 or July 2011. Clearly the trend is for the market to go back to predominantly normal sales. In fact if we only count normal transactions, this July was the highest sales month since July 2005 at the height of the housing bubble.
This is the fourth month in a row we have seen year over year growth in the total monthly sales rate. Prior to this we saw lower sales rates between March 2012 and March 2013. We are also seeing the annual sales rate in an upward trend. These are encouraging signs.
We now have 2.7 months of supply, including UCB listings, up from 2.2 last month. At the same points in 2012 we went from 2.4 to 2.9, so a very similar pattern. If we exclude UCB listings we have 2.2 months of supply, up from 1.9 last month. The UCB counts are still falling now that short sales are declining fast.
The average days on market for monthly sales is down to 65 days from 72 last year. However the average days on market for active listings is still up at 107, down from 125 on August 1, 2012. This tells us that the inventory of active listings still contains many homes that are unlovable or over-priced. Attractive homes at realistic prices are relatively few and far between and often last only a few days before they go under contract.
The dollar volume for July was $1.94 million. 36.5% higher than July last year and the highest July total since 2006. In fact it was not a long way short of June 2006’s $2.02 million. This is a very powerful number and is consistent with a healthy and growing market. This is another reason I believe demand is stronger than the Contract Ratio and Cromford Market Index™ are indicating.
The number of new listings added in July 2013 was slightly higher than July 2012, but remain at unusually low levels. When looking at changes in the number of active listings over the last month, there is a lot a variation by geography. For example we see:
- Tolleson – up 28%
- Glendale – up 19%
- Tempe – up 15%
- Laveen – up 14%
- Avondale – up 14%
- Anthem – up 14%
- El Mirage – up 11%
- Goodyear – up 9%
- Gilbert – up 8%
But
- Paradise Valley – down 10%
- Casa Grande – down 10%
- Arizona City – down 9%
- Sun City West – down 8%
- Sun City – down 6%
- Sun Lakes – down 5%
- Surprise – down 4%
- Scottsdale – down 4%
Generally supply has improved in the west and southeast but worsened in the northeast, 55+ and luxury markets and in some parts of Pinal county.
Supply remains very low relative to demand but the gap is slowly starting to close.
The appreciation rate has moved back over 20% because prices were falling last year at this time (during the summer) slightly faster than they are falling this year. July gave us another increase in the median sales price and a fall in the average price per sq. ft. This is also normal for the summer. Luxury homes have virtually no impact on the median but contribute heavily to the price per sq. ft. Our short term outlook is still for pricing to remain in a tight range around $120 per sq. ft. for the next months and into the first half of September.


