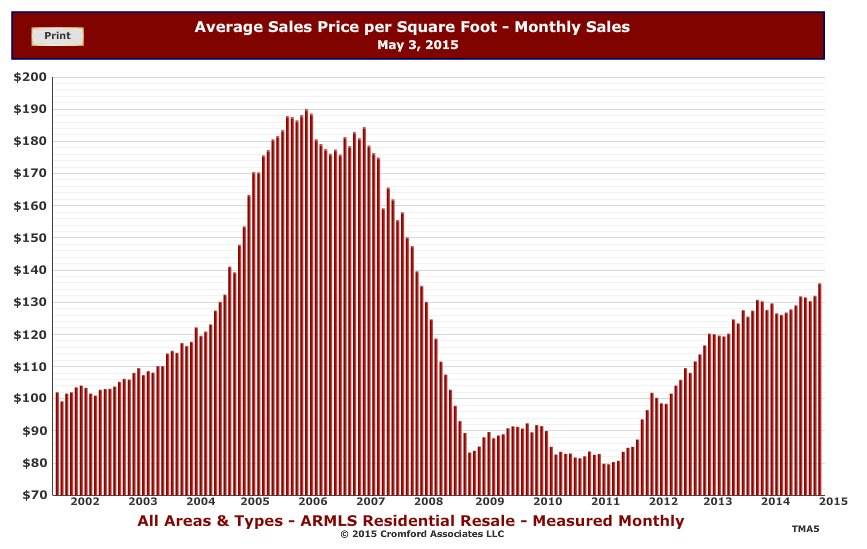
March fulfilled and even exceeded most sellers hopes with strong sales across the vast majority of price ranges and geographic areas. The major improvement in demand that we first saw in February has spread to more areas and has moved strongly upmarket too.
Here are the basic ARMLS numbers for April 1, 2015 relative to April 1, 2014 for all areas & types:
- Active Listings (excluding UCB): 22,303 versus 26,442 last year – down 15.7% – and down 4.8% from 23,541 last month
- Active Listings (including UCB): 26,436 versus 29,907 last year – down 11.6% – and down 3.2% compared with 27,315 last month
- Pending Listings: 7,853 versus 7,333 last year – up 7.1% – and up 17.1% from 6,709 last month
- Under Contract Listings (including Pending & UCB): 11,988 versus 10,798 last year – up 11.0% – and up 14.3% from 10,483 last month
- Monthly Sales: 7,855 versus 6,680 last year – up 17.6% – and up 35.2% from 5,812 last month
- Monthly Average Sales Price per Sq. Ft.: $131.95 versus $130.74 last year – up 0.9% – and up 1.3% from $130.27 last month
- Monthly Median Sales Price: $200,000 versus $189,500 last year – up 5.5% – and up 2.6% from $195,000 last month
There is very little to dislike in this batch of numbers, if you are a seller. However buyers are facing the prospect of prices increasing if these conditions prevail for a few more months.
The rise in the under contract count over last year – up 11.0% – understates the magnitude of the improvement because the concurrent reduction in distressed listings keeps a lid on this measure. The same is true of the sales improvement.
It is instructive to look at the same measures restricted to normal listings across Greater Phoenix:
- Active Listings (excluding UCB): 19,835 versus 23,096 last year – down 14.1% – and down 6.0% from 21,103 last month
- Active Listings (including UCB): 23,148 versus 25,493 last year – down 9.2% – and down 3.9% compared with 24,075 last month
- Pending Listings: 6,726 versus 5,776 last year – up 16.4% – and up 18.9% from 5,656 last month
- Under Contract Listings (including Pending & UCB): 10,039 versus 8,173 last year – up 22.8% – and up 16.4% from 8,628 last month
- Monthly Sales: 7,174 versus 5,825 last year – up 23.2% – and up 38.8% from 5,170 last month
- Monthly Average Sales Price per Sq. Ft.: $134.78 versus $135.18 last year – down 0.3% – but up 0.6% from $134.04 last month
- Monthly Median Sales Price: $207,000 versus $198,050 last year – up 4.5% – and up 2.0% from $203,000 last month
We note that the median sales price and average price per sq. ft. are behaving differently, a sure sign of change in the mix, with the buoyant mid-range keeping the average $/SF down but pushing the median price up.
We can also see the huge growth in the usage of UCB to replace Pending status for normal listings. We estimate 60% of normal UCB listings are really pending and falsely marked as UCB. Last year at this time the number was 55% and the year before that 40%.
The price ranges showing the greatest improvement in demand over supply compared to their long term average are:
- Over $3M +64%
- $250-275K +35%
- $225-250K +32%
- $200-225K +28%
- $2-3M +26%
- $600-800K +23%
- $1.5-2M +22%
- $400-500K +15%
- $275-300K +14%
- $175-200K +12%
- $125-150K +10%
- $300-350K +7%
- $1-1.5M +5%
- $150-175K +4%
- $350-400K +2%
- $500-600K +2%
These numbers are for single family homes only. They are based on comparing the current contract ratio with the long term average ratio for that price range. Contract ratios decline dramatically as you look at higher price ranges, and this applies in all market conditions.
The price ranges over $800K were looking tired at the end of February, but just look at them now, especially the ultra-luxury segment. There were 29 homes over $3 million under contract as of April 1 compared with just 16 last year. This is the most we have seen since 2007.
A few ranges are not looking so hot: below $100K is experiencing low supply and even lower demand while $800K to $1M is stuck at its long term average.
We are seeing the first signs of some extra supply coming along, as in the last week the rate of new listings has ticked up just a tad. It is quite natural for news of the stronger market to bring out some more sellers. If this continues it will help keep the market from getting too frenzied.
This is certainly a lot more interesting and exciting than last year.

