“Housing Prices Fell in March for 8th Straight Month”
“Housing Imperils Recovery”
“U.S. Housing Market in Double Dip as Prices Fall to Fresh Lows”
“Home Prices Continue on their Downward Spiral With No Relief in Sight”
Those were a few of the latest real estate headlines from national media sources reporting statistics from the S&P Case Shiller Index tracking national home prices. Based on those headlines you would think housing nationwide was in free fall, with no sign of any housing recovery in sight.
Now let’s look at what’s happened in Maricopa County over the last 8 months for median sales price of homes:
$120,000 – Oct 2011
$115,000 – Nov 2011
$110,500 – Dec 2011
$110,000 – Jan 2011
$109,000 – Feb 2011
$110,000 – March 2011
$111,000 – April 2011
$109,313 – As of today June 3rd.
Two important things to note here:
1) National real estate data is pretty much worthless when considering local market activity
2) The S&P Case Shiller index is usually a few months behind tracking real estate market activity.
Do those monthly median sale prices look like we are in free fall with no end in sight? No… they don’t, and with 6 straight months within $1,000 or less of $110,000 for median sale price, those levels looks more like a pretty good and stable base of pricing. I like this quote from Tom Ruff’s Housing Opinion from the Cromford Report, “To put these reports into perspective, it would be equivalent to turning on tonight’s news and seeing a report trumpeting turkey as the perfect Thanksgiving dinner instead of seeing traveling tips for the upcoming Memorial Day weekend. The double dip occurred in late November, not early May.” Or like picking up a carton of milk at the grocery store today under a banner saying fresh milk, and then finding out the “use by” expiration date is 4 months past. Since last Fall, prices have been relatively stable. Market activity has turned a corner and become very busy, of which buyers just entering in to the market are being caught off guard.
Pricing is a lagging indicator of market activity
Prices are only part of the story when we look at trying to gauge a housing recovery. As with anything related to market values, prices are mainly driven by a balance between supply and demand, if there’s more homes than people want to buy prices will fall, if there’s a shortage of homes prices will rise, and if there’s a balance between supply and demand prices should be stable or see a subtle rise. Also worth noting is pricing is usually a lagging indicator of real estate market activity 3 months prior to the latest price data. Someone entering in to the market today may spend a few weeks looking at several properties, make an offer, and then close on the home 4-6 weeks later. This would end up an average being somewhere around 2-3 months, start to finish, for someone beginning their search for a home today. An uptick in market demand or a decrease in inventory likely won’t be reflected in pricing till a few months down the road.
Supply
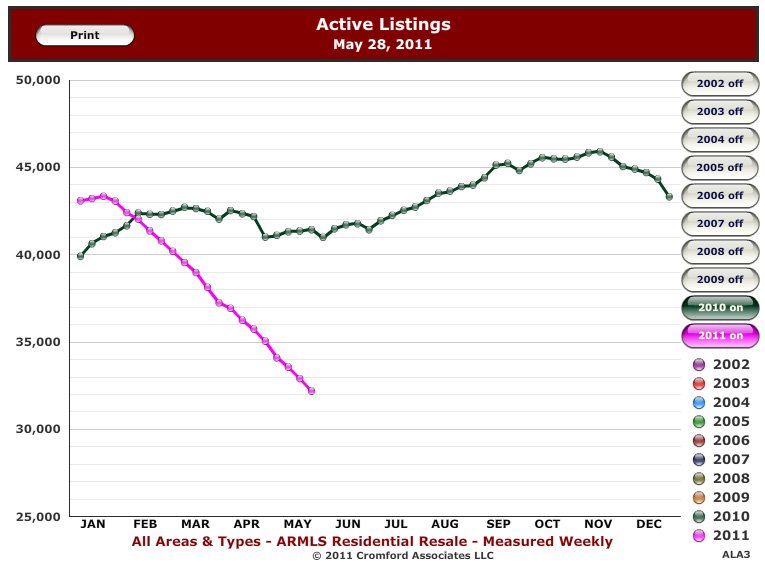
Let’s look at the inventory to give us an idea of supply of currently available homes on the market. We are at supply levels not seen since 2006, and if those levels continue falling then we are in for some interesting shifts in the market. Multiple bid situations on homes, with having to compete against other buyers making offers on a home at the same time as you are, might become the norm. I’d say it already has from some of my recent experiences with buyers. If a home is priced decent, in decent condition, in a decent neighborhood…count on some heavy competition from other buyers interested in the same home. Six out of the last seven offers I’ve written for clients over the last 3 months have all ended up in a multiple offer situation. Inventory peaked in November at 45,935 homes available. Since then we have been declining steadily all the way down to 31,942 today, a drop of about 30%. So inventory supply has dropped, good for recovery, what about demand?
Demand
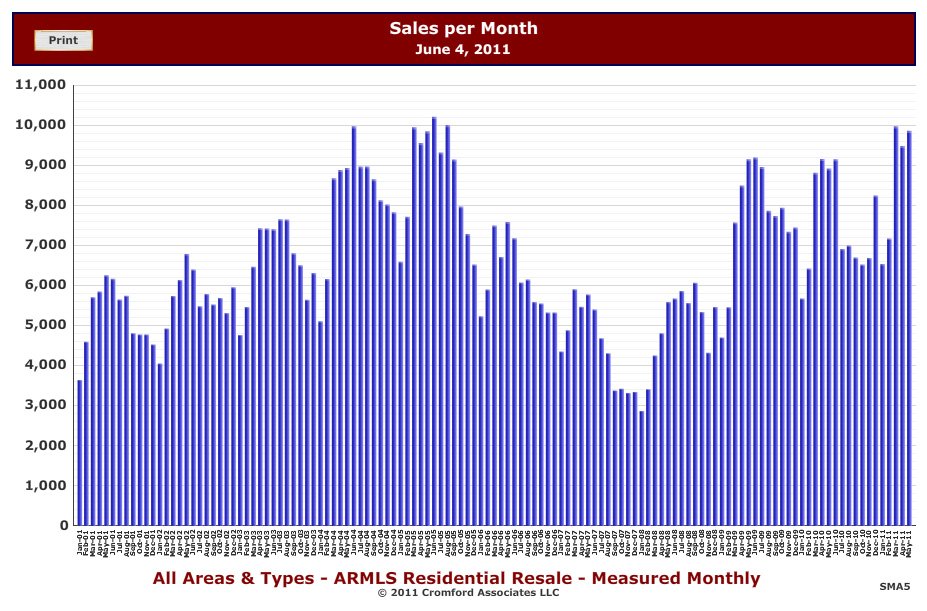
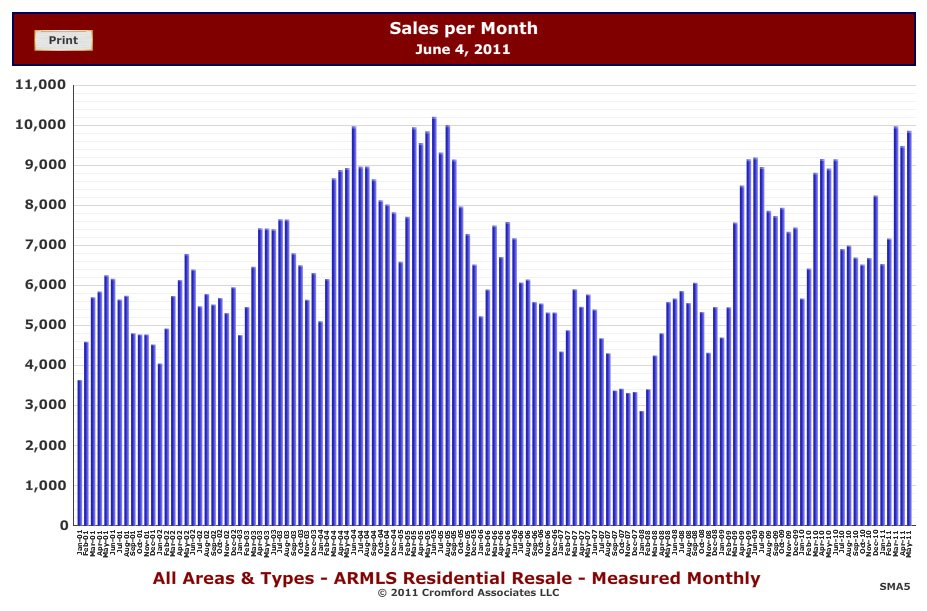
For the month of March we had a total of 9,901 closed sales tracked on the Arizona Regional MLS. This was the 5th highest month for recorded sales ever recorded on ARMLS, with the only months surpassing that being the boom days back in 2004 and 2005 topping out at 10,213. In May we had 9,862 closed sales, which is putting 2011 nearly on the same track as 2005, the busiest Spring home buying season in the last 10 years for Arizona (for March-May 2005 there were 29,353 properties sold, for the same 3 month period this year in 2011 there were 29,313). Now this doesn’t mean we’re going to see any huge price appreciations of 50% all in one year like we saw in 2005, but it should be a strong sign of strength towards a recovery with plenty of demand.
These numbers are even more encouraging when you consider the buying activity and demand now is even stronger than last Spring in 2010 when we had the home buyer tax credit. A lot of economists, and others agree, that the tax credit created somewhat of an artificial demand of buyers that normally wouldn’t be buying at that time. That did appear to be true, with a big drop in sales and market activity after the home buyer tax credit expired in the summer. Things were slow through the fall and winter, and then buyers roared back with a vengeance this Spring even stronger than last year, despite not having any big government incentive like a tax credit available. All the activity today is organic growth and a better picture of true demand, without any artificial stimulus.
People buying today are buying because it’s affordable and it makes sense for them, and that’s what you have to consider for yourself, taking into account your financial picture today and long term. With home prices low and mortgage interest rates at even historically lower rates, buying a home for many people in the Phoenix area has become very affordable, especially compared to what they might be paying for rent on a similar home. Investors are another large chunk of the buyers today, as they find the return on investment for them to be very profitable in purchasing properties at bargain prices and leasing them out for very attractive returns.
What about foreclosures?

“In the world of foreclosures, the big news is the rapid fall of new notices of trustee sale.” (foreclosures usually occur 90 days after a notice of trustee sale has been issued)… “April delivered only 4,418 new notices in Maricopa County of which 4,200 were residential. This is the lowest monthly total since December 2007, nearly three and a half years ago.” For reference, in March 2009 we had 10,100 residential notice of trustee sale issued, and in March 2010 there were 7,614 notices of foreclosure.
“Completed trustee sales in Maricopa County fell back from the March high as expected, but at 4,709 (4,513 of which were residential) they far outstripped the new notices for the first time ever. This signals a significant phase change in the foreclosure tsunami as the activity starts to decline more rapidly. We are now seeing huge reductions in the pending foreclosure counts, with active (outstanding) notices at the end of April reading 32,203 which contrasts with 51,466 at the end of 2009 and 41,478 as recently as the start of 2011.
Supply continues to fall at a fast rate and demand is getting stronger. Nevertheless the short term sales price outlook still remains stuck in neutral. This is due to a number of factors including negative sentiment among ordinary home buyers and a tendency for appraisals to be extra cautious which tends to push transaction prices a little lower than they otherwise would be if prices were determined by buyers and sellers alone. However inventory is now down to the same levels (3.8 months supply) as in 2002 when average pricing used to appreciate at 2 to 5% per year. As we said last month, the changes in indicators other than price are almost all positive and therefore we do not see another significant price drop on the horizon unless and until circumstances change.
The last three and a half months have been the most stable in pricing that we have seen for many years.”
Total residential inventory is actually down to a 3.2 months supply now.
The Infamous Shadow Inventory
Total number of bank owned homes obtained through foreclosure currently sit at 18,451. Some have theorized there’s a large shadow inventory of foreclosure the banks possess which they are holding on to and not putting on the market for various reasons, which if dumped on the market would devastate home values. How many of those properties which banks hold ownership to are currently on the market for sale or pending under contract?
Active: 4,446
AWC and Pending: 6,068
Total: 10,514
This leaves 7,937 properties the banks hold on their books in which they have not yet put on the market. Even if they dumped this whole inventory of 7,937 on the market tomorrow, it wouldn’t be much of a flooding of the market at all. This potential “flood” of shadow inventory of foreclosures could actually be absorbed fairly quickly into the market. In May 4,361 foreclosures were sold on the open market through the MLS. 4,446 REO’s (foreclosures) are currently on the market for sale, being bought up at a pace of nearly the same number yields only about a one month supply if nothing changed tomorrow. The “shadow inventory” if suddenly added to the current inventory, could be absorbed in only about 3 months assuming no new REO properties came on the market (12,000 REO homes at a pace of 4,000 per month) If we keep up at the pace of 4,000-5,000 foreclosures occurring each month and ending up on the market, that would add roughly an extra month of supply to total 4 months supply. A 4 month supply of real estate is still a relatively quick moving market for Phoenix, and is not the kind of market activity or balance that leads to devastation.
What’s going to happen when all of these foreclosure properties finally go away, the job market and the rest of the economy come back strong, demand keeps up strong, all the buyers on the fence waiting for the first glimpse of recovery decide to jump in, and if homebuilders don’t start building new construction homes soon? We could have a very serious shortage of available homes on the market in the very near future (1-2 years) and things could get very interesting. Just as the majority of people were not able to call the market top and bust, most people won’t be able to call the market bottom and next boom.
Relationship between months supply of inventory and pricing
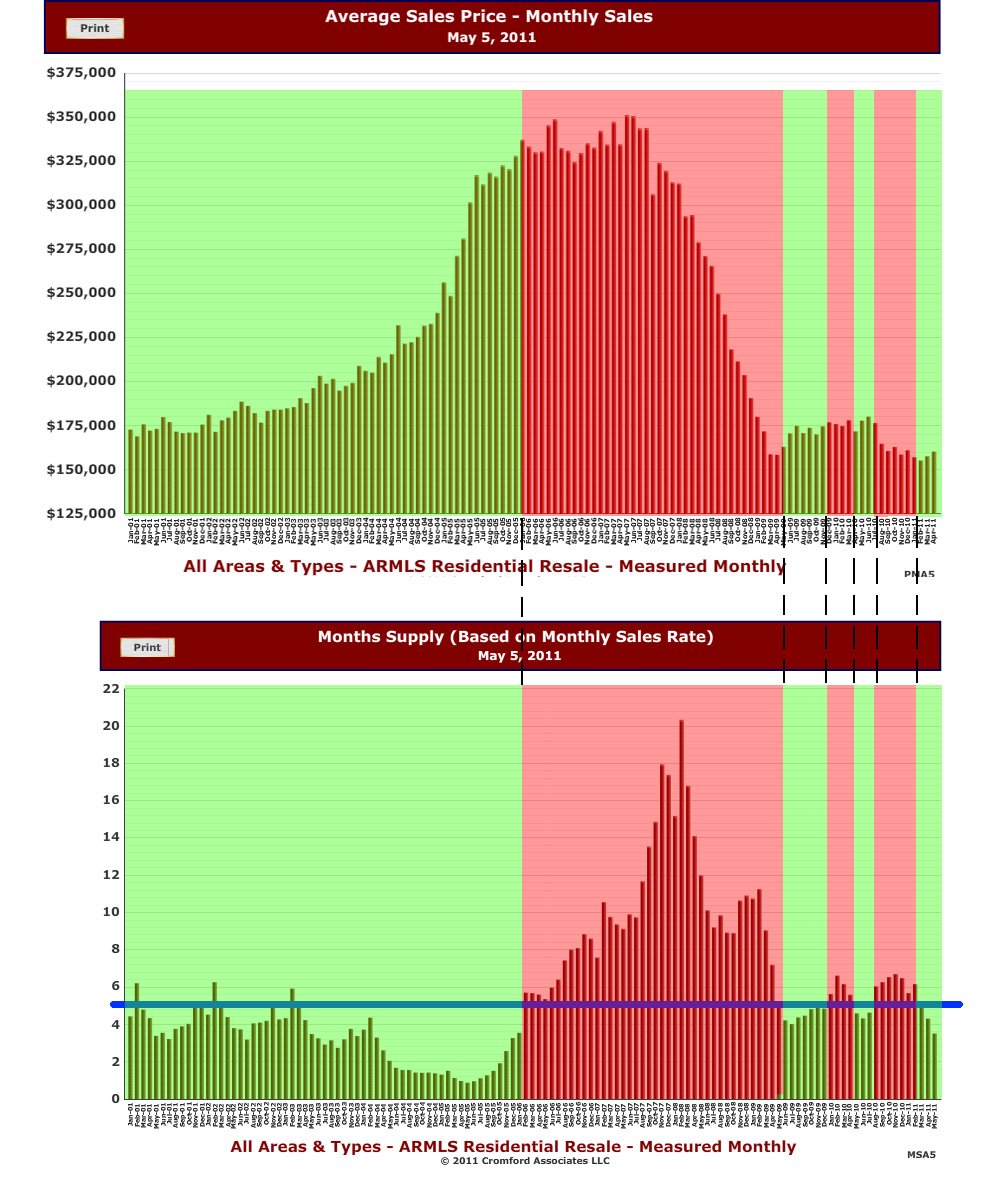
A good gauge many people use to measure market activity is the months supply of inventory, or how many months would it take for all the homes to be bought up if buying continued at the same pace from today and no new homes were listed on the market for sale. An average or healthy balanced market’s months supply of inventory is generally considered to be around 5 months. Moving much above 5 months is considered to be slow and prices will stagnate or likely fall, and below 5 months is considered to be a hot market where prices will at least stabilize or begin to appreciate. We currently are sitting at 3.2 months. At that rate what do you think that’s going to do to pricing in the short term? See the chart below noting periods where the months supply was below or above 5 months for at least 2 consecutive months, and see what happened to pricing over the last 10 years. Draw your own conclusions.


