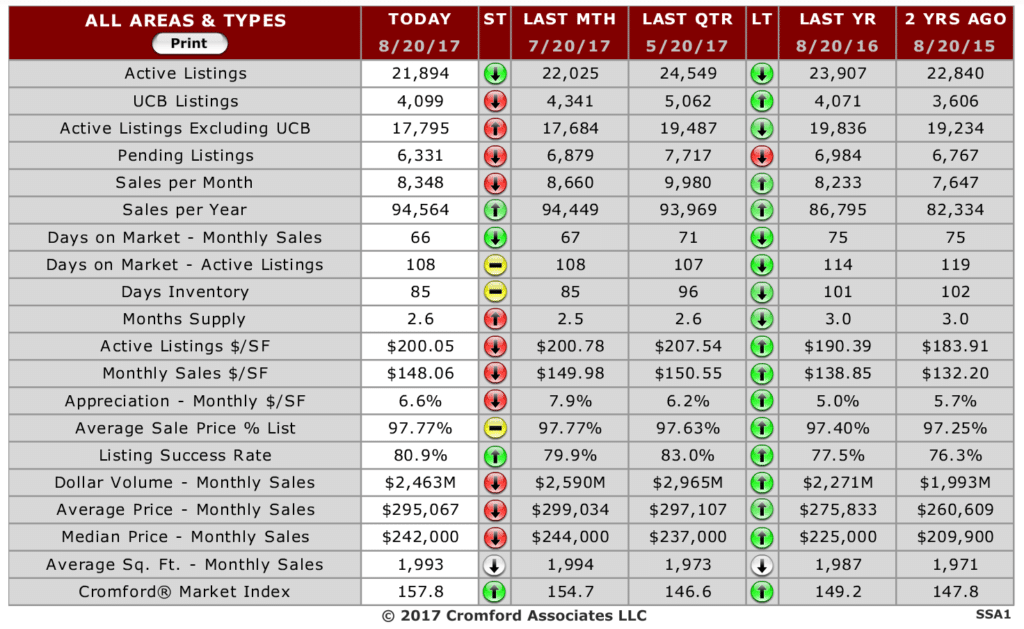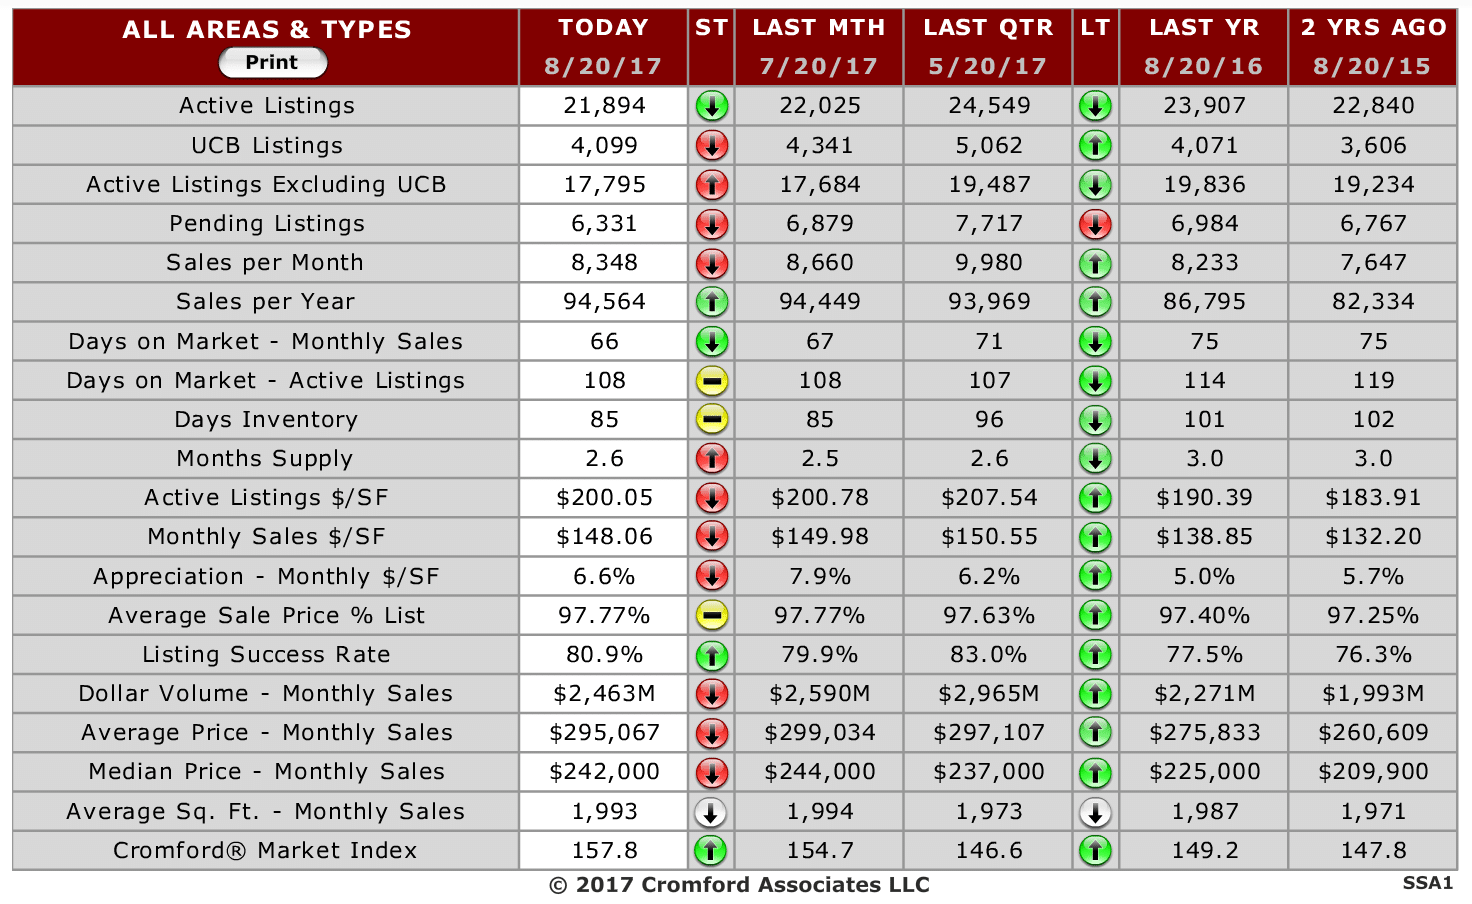
Starting with the basic ARMLS numbers for July 1, 2017 and comparing them with July 1, 2016 for all areas & types:
- Active Listings (excluding UCB): 18,087 versus 20,458 last year – down 11.6% – and down 2.1% from 18,476 last month
- Active Listings (including UCB): 22,301 versus 24,856 last year – down 10.3% – and down 4.2% compared with 23,281 last month
- Pending Listings: 6,486 versus 6,985 last year – down 6.1% – and down 11.4% from 7,324 last month
- Under Contract Listings (including Pending, CCBS & UCB): 10,700 versus 11,383 last year – down 6.0% – and down 11.8% from 12,129 last month
- Monthly Sales: 9,512 versus 8,996 last year – up 5.7% – but down 3.5% from 9,858 last month
- Monthly Average Sales Price per Sq. Ft.: $151.83 versus $140.97 last year – up 7.7% – and up 0.9% from $150.46 last month
- Monthly Median Sales Price: $245,000 versus $230,000 last year – up 6.5% – and up 2.1% from $240,000 last month
Supply remains significantly lower than last year, but not quite as much as last month, when there was a 11.6% gap in terms of active listings with no contract. The drop in supply over the last month (2.1%) was concentrated in areas that cater to the 55+ home buyer and higher priced areas. This follows a normal seasonal pattern that repeats every July. Some less expensive areas have a little more supply than last month.
The monthly sales rate is up 5.7% compared with a year ago. Both June 2016 and June 2017 had the same number of working days so at last we have a fair comparison to draw. The last 3 months were all distorted by different working day counts which favored March and May but disadvantaged April. We see a slight downward trend in the advantage that 2017 has over 2016 in sales volume, but almost 6% is still a very positive rise.
In common with the USA as a whole, we are seeing lower counts for pending listings and listings under contract, compared with the same time last year. This fall is quite large but so far has not been matched by a drop in sales. We discussed some of the underlying reasons for this fall in our daily observation for June 7. Despite this disconnect between under contract counts and sales counts, we can detect a slight cooling trend in both numbers. In other words, although sales are up, the demand indicators have been gradually weakening over the past few months. This weakening is hard to detect out there in the real world because has not been as pronounced as the weakening in supply. Hence the balance in the market has continued to get more favorable for sellers rather than buyers.
With prices up almost 8% (based on monthly average $/SF) it should not be surprising that demand is tailing off. If it were increasing in the face of such a strong price increase we would be suspecting the illogical enthusiasm associated with a bubble. As it is, the market is well behaved and shows none of the symptoms we associate with a market bubble.
After 2 years under-performing the rest of the market, we are now seeing improvement in the numbers coming out of the Northeast Valley. This is especially obvious in the Cave Creek and Scottsdale areas. In contrast some parts of the Southeast Valley have cooled off compared with the first part of the year. However Mesa and Queen Creek remain quite buoyant.
The overall changes in the market are quite mild and tricky to detect without close analysis. We will be reporting on some of those changes in the daily observations section over the coming weeks.


