Here’s the latest data for Phoenix Housing brought to us by The Cromford Report.
As forecast a month ago, average and median prices are easing up as we head into late June with the average $/SF for monthly sales across all areas and types at the same level ($101.25) as it was on May 29. The hottest months rarely see prices move sharply upwards – and after a very strong move during the spring it is time for some consolidation. The higher price levels we now see should also bring a little more supply into play for the third quarter, though it’s doubtful it will be enough to make buyers feel much relief from multiple bid situations. It would take a very large increase in supply to accomplish that.
As prices continue to rise (though now the rate of increase is starting to cool down as expected), demand will weaken and more sellers will be motivated to enter the market. What we don’t yet know is how far they will have to rise before balance can be restored between supply and demand.
")
Here’s an example of the wildness of this current market. It gives a wake up call to anyone who still thinks shopping for a home in Phoenix is easy pickings with little competition. Not all homes receive this kind of activity, so it is an extreme case, but still gives an idea at how short supply is in contrast to current demand. Price increases and this level of activity won’t go on forever, and hopefully soon we will get back to more of a balanced market.
A normal listing in Glendale 85308, MLS # 4745038, was listed at $119,900 and received a total of 95 offers, finally selling for $140,000 cash. Among the 95 offers, 38 were all cash, 28 were conventional and 28 were FHA/VA. 51 offers came from investors and 44 from owner occupiers. The home is already listed for rent at $1,200 per month by the winning investor.
Prices have run up so much in the last three months, as fast as at any time in history, that there may be a danger of them getting ahead of themselves. Inventory continues to decline and buyer desperation hits new heights each week, but several market indicators suggest we may be moving a little too fast to avoid hitting an air pocket or two. Sales and pending counts are well down compared with last year, partly caused by a lack of supply but there are two other reasons to be somewhat cautious:
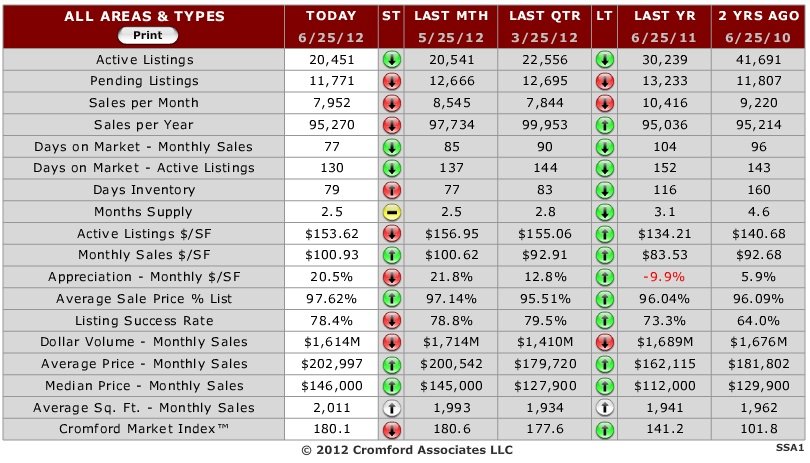
- the average $/SF for pending listings has fallen 1.4% in the last month
- the average sq ft. for monthly sales has risen by 1.7 from 1,965 to 1,998
The second reason suggests some of the price rise in May was due to an increased number of more luxurious homes in the mix. This is to be expected as they are more available than the cheaper homes. However, on top of the reduction in HUD homes and REOs this means our sales mix is driving a significant part of the increase in average and median prices. While prices are certainly increasing, the values of specific homes are not increasing as fast as the overall market numbers suggest.
The first reason suggests that the upward price trend may take a pause at some time in the near future, Sales prices cannot keep going up faster than the prices in escrow forever. Either the average price of homes in escrow has to catch up or the price of homes sold has to slow down a bit. If prices move up too fast then demand may stall as buyers give up, unable to afford what they want or unable to make the profit they need as investors.
The average price per sq ft across all areas & types in ARMLS has moved from $87.53 on March 2 to $101.23 on June 2 – that’s an increase of 15.6% in 3 months which is every bit as fast as prices were rising in the summer of 2005. It also implies an annual appreciation rate of 62.4% if we were to keep it up for another 9 months. That is not impossible but it is very unlikely. The fastest we saw during the bubble years was about 45% per annum.
Let us look at some basic numbers for June 1, 2012 relative to June 1, 2011. For all areas & types across ARMLS we record the following:
- Active Listings (excluding AWC): 12,491 versus 23,609 last year – down 47%
- Active Listings (including AWC): 19,977 versus 31,346 last year – down 36%
- Pending Listings: 11,656 versus 13,268 last year – down 12%
- Monthly Sales: 8,492 versus 9,806 last year – down 13%
- Monthly Average Sales Price per Sq. Ft.: $101.30 versus $82.61 last year – up 23%
- Monthly Median Sales Price: $145,000 versus $109,000 last year – up 33%
The luxury market is showing signs of some improvement but this is possibly just a seasonal effect. Last year the third quarter was very weak for the luxury segment. If it can continue to improve through the third quarter of 2012, then this will be more significant.
The Maricopa County foreclosure statistics for May were:
- New Notices of Trustee Sale: 4,533 versus 4,449 in April – up 1.9% for the month (but given there were 22 working days in May instead of 21 in April, this represents a small decline in the rate per day)
- Trustee Deeds Recorded: 2,145 versus 1,727 in April – up 24% for the month (but down 51% compared with May 2011)
According to the latest figures from Lender Processing Services, Arizona now ranks 35th among the states for non-current loans at 9.0%, having fallen below Missouri and Texas. It will take quite a bit of effort to sink lower down the delinquency table, as Kansas is our next target well below us at 8.5%. The national average is 11.3% so Arizona is already significantly better than the average for the USA.