Market Summary for the Beginning of August
Starting with the basic ARMLS numbers for August 1, 2017 and comparing them with August 1, 2016 for all areas & types:
- Active Listings (excluding UCB): 17,412 versus 19,711 last year – down 11.7% – and down 3.7% from 18,087 last month
- Active Listings (including UCB): 21,484 versus 23,801 last year – down 9.7% – and down 3.7% compared with 22,301 last month
- Pending Listings: 6,085 versus 6,807 last year – down 10.6% – and down 6.2% from 6,486 last month
- Under Contract Listings (including Pending, CCBS & UCB): 10,157 versus 10,897 last year – down 6.8% – and down 5.1% from 10,700 last month
- Monthly Sales: 8,003 versus 7,770 last year – up 3.0% – but down 16.8% from 9,615 last month
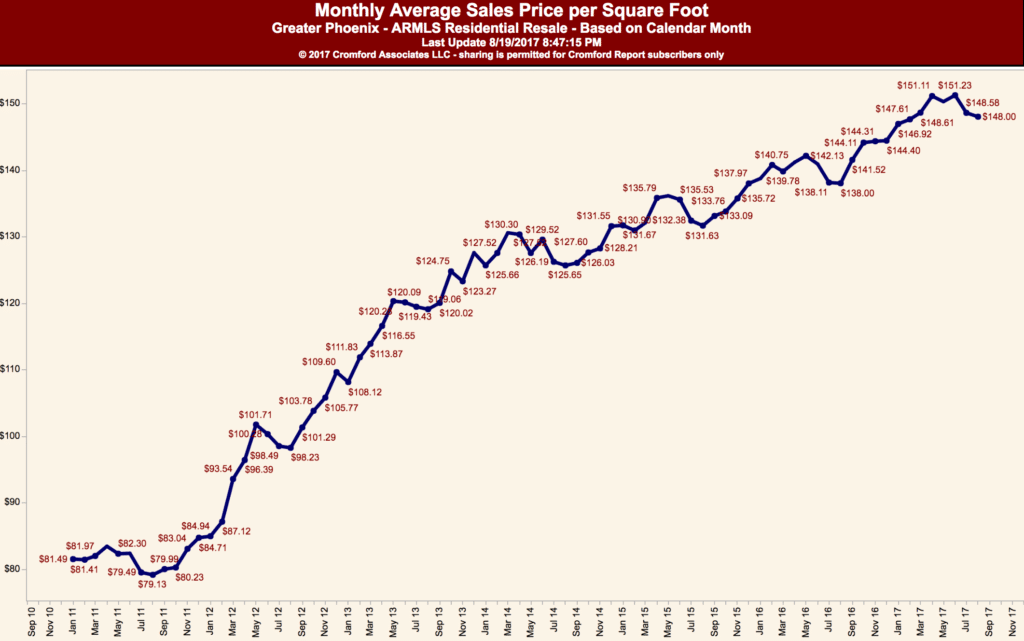
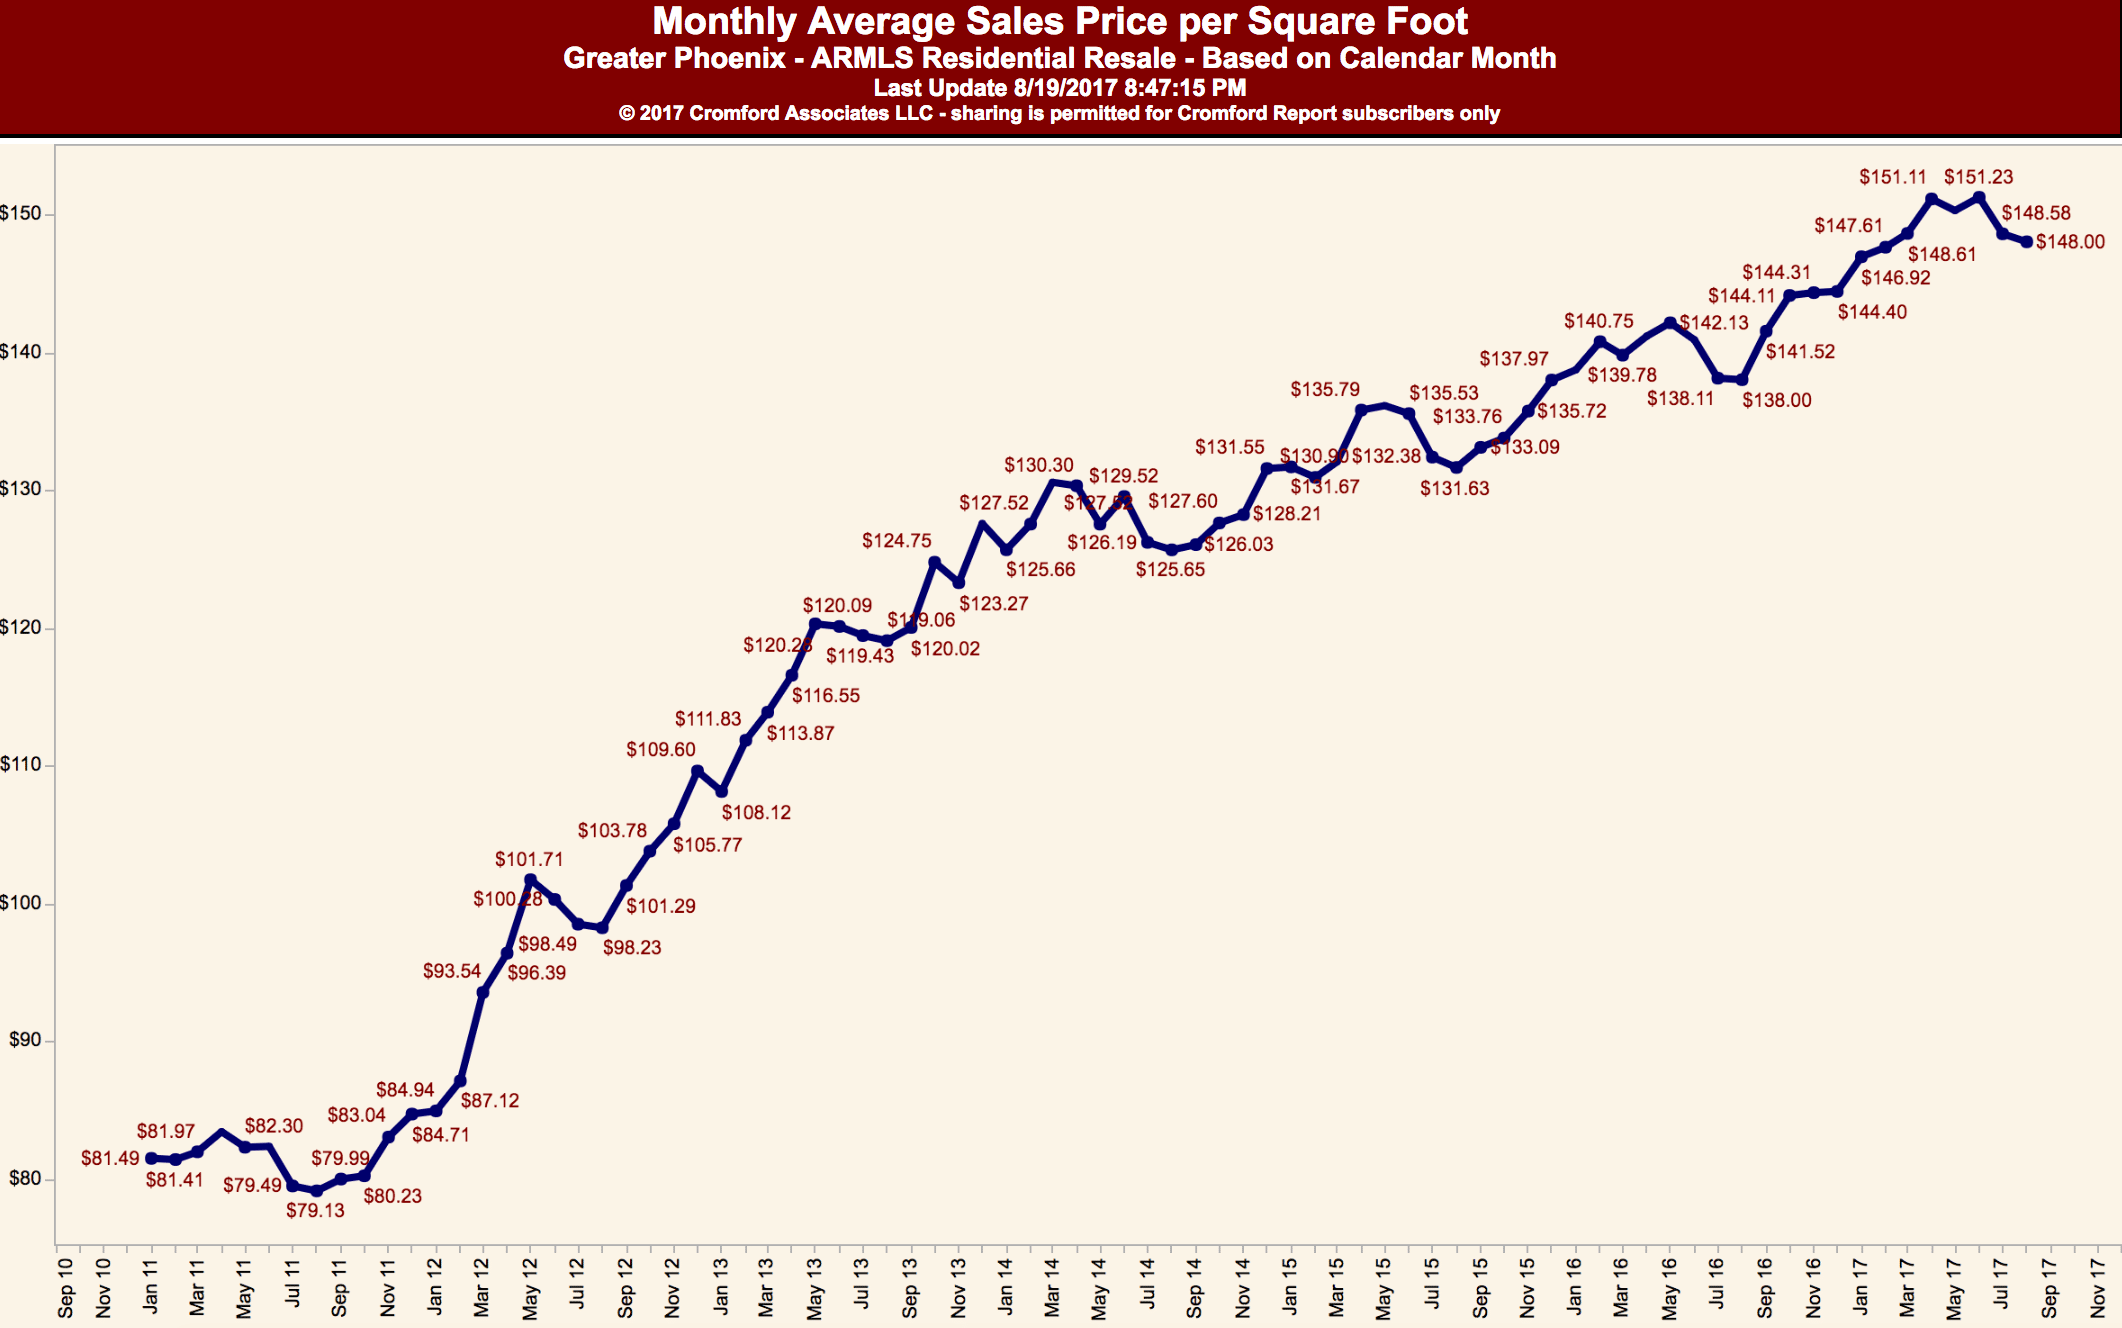
- Monthly Average Sales Price per Sq. Ft.: $148.85 versus $138.39 last year – up 7.6% – but down 1.8% from $151.64 last month
- Monthly Median Sales Price: $241,000 versus $225,000 last year – up 7.1% – but down 1.6% from $245,000 last month
Supply remains significantly lower than last year, and the gap widened slightly compared with last month in terms of active listings with no contract. The drop in supply over the last month (3.7%) was concentrated in the price range from $225,000 to $250,000 and in the ranges over $1 million. Price ranges below $175,000 have a little more supply than they did last month, a new trend that we have now seen for two months running.
The monthly sales rate is up 3.0% compared with a year ago. Both July 2016 and July 2017 had the same number of working days (20) so we have a fair comparison to draw. Since the year over year growth was 5.7% in June we see a continuing slow downward trend in the advantage that 2017 has over 2016 in sales volume. Growth in the annual sales rate is also slowing which confirms this trend.
We experienced a significant price drop between June and July, but this is no surprise. It happens almost every year, and in fact the drop in 2016 was larger. The effect is primarily due to the decline in luxury home activity. On an annual basis appreciation is running at 7.6% when measured by average $/SF and 7.1% when measured by median sales price. Both of these are very strong compared with general rates of inflation but are unspectacular in the context of the wider housing market. Washington, Oregon, Idaho, Utah and Colorado are seeing even faster appreciation, while California, Nevada and Florida are similar to Arizona. Only Alaska is seeing home prices declining year over year.
Appreciation is fine for the home owner, but translates into loss of affordability for the potential home buyer. Prices are being driven higher by a natural and persistent lack of supply, not irresponsible speculation. In this situation it is normal for prices to rise until they suppress demand enough to match the weak supply and we reach equilibrium. That is fundamental to economic theory. So we should not be surprised if sales volumes lose some of the momentum they have seen during the first half of 2017.
Of course the nature of demand is always in flux. At the moment Arizona’s population increase is concentrated in the older age groups which portends strong markets in the housing areas that appeal to this sector. Birth rates are weak and getting weaker, so natural population growth is unlikely to be much of a factor in driving future housing demand. In-migration is key to the state and much of that in-migration has been dominated by retirees, or at least those over 55. This different from the situation prior to 2007 which saw strong in-migration from the under 40s. We anticipate the median age in Greater Phoenix will increase quite markedly over the next decade. This will have a number of economic effects, not just on housing.


