Market Summary for the Beginning of July
Top 5 Cities Selling Over Asking Price
Contracts Accepted in 8 Days or Less Under $400K

Here are the basics – the ARMLS numbers for July 1, 2020 compared with July 1, 2019 for all areas & types:
- Active Listings: 8,788 versus 15,422 last year – down 43.2% – and down 26.5% from 11,917 last month
- Under Contract Listings: 13,424 versus 11,230 last year – up 19.5% – and up 7.6% from 12,478 last month
- Monthly Sales: 9,702 versus 9,476 last year – up 2.4% – and up 37.8% from 7,040 last month
- Monthly Average Sales Price per Sq. Ft.: $182.71 versus $172.17 last year – up 5.8% – and up 1.6% from $179.82 last month
- Monthly Median Sales Price: $305,000 versus $279,000 last year – up 9.3% – and up 4.1% from $293,000 last month
The numbers above represent some of the largest percentage movements we have ever seen during a single month. The market remains a long way from normal, so we should probably expect further dramatic changes over the next few months.
Supply is crashing – down 26.5% (excluding UCB and CCBS listings) in a single month – and this is the most important factor in the state of the market. Without an improvement in supply, life will become ever more difficult for buyers while sellers will be dealing with many competing offers even if demand were to decline substantially. For sellers this is a nice problem to have, but for buyers the level of competition from other buyers presents a massive obstacle to them achieving their goals. This extends to the iBuyers who have seen their acquisition numbers collapse since the first quarter. Their market share has dropped substantially as a result.
Demand has recovered from the pandemic-induced slump of April and May and is now benefitting from the catch-up effect, replacing the sales that were deferred during the second quarter. At price points below $600,000, the market is constrained by the shortage of homes for sale.
Price measurements took a hit during April and May due to a few panic sales and the small number of high-end homes closed, but they are recovering at a fast pace now. The median sales price is juiced up by the lack of homes selling under $275,000 and the monthly median rose over 4% during the single month of June. We expect this to continue as a strong upward trend while homes under $400,000 remain in very short supply. The average $/SF is a more stable measurement but this rose 1.8% during June, as the top end of the market started to function properly again. Based on the number of luxury homes that are under contract, the average $/SF for July is expected to be substantially higher this time next month. Both list price and under contract price $/SF are now in an upward trend.
The Cromford® Supply Index has dropped from 52.9 to 44.1 over the last month. The normal reading is 100 and 41.3 represents the record low touched in April 2005. It is looking likely that we will crash through that record low during July. The Cromford® Demand Index has recovered from 83.7 to 102.5, a remarkable surge, taking us from well below normal to slightly stronger than normal (100). At the moment both the CSI and CDI numbers are diverging so the Cromford® Market Index can only go higher still. It stood at 232.7 on July 1 and the record high is 313, set in the spring of 2005. This is the first time that record has looked in danger since 2005.
For Buyers:
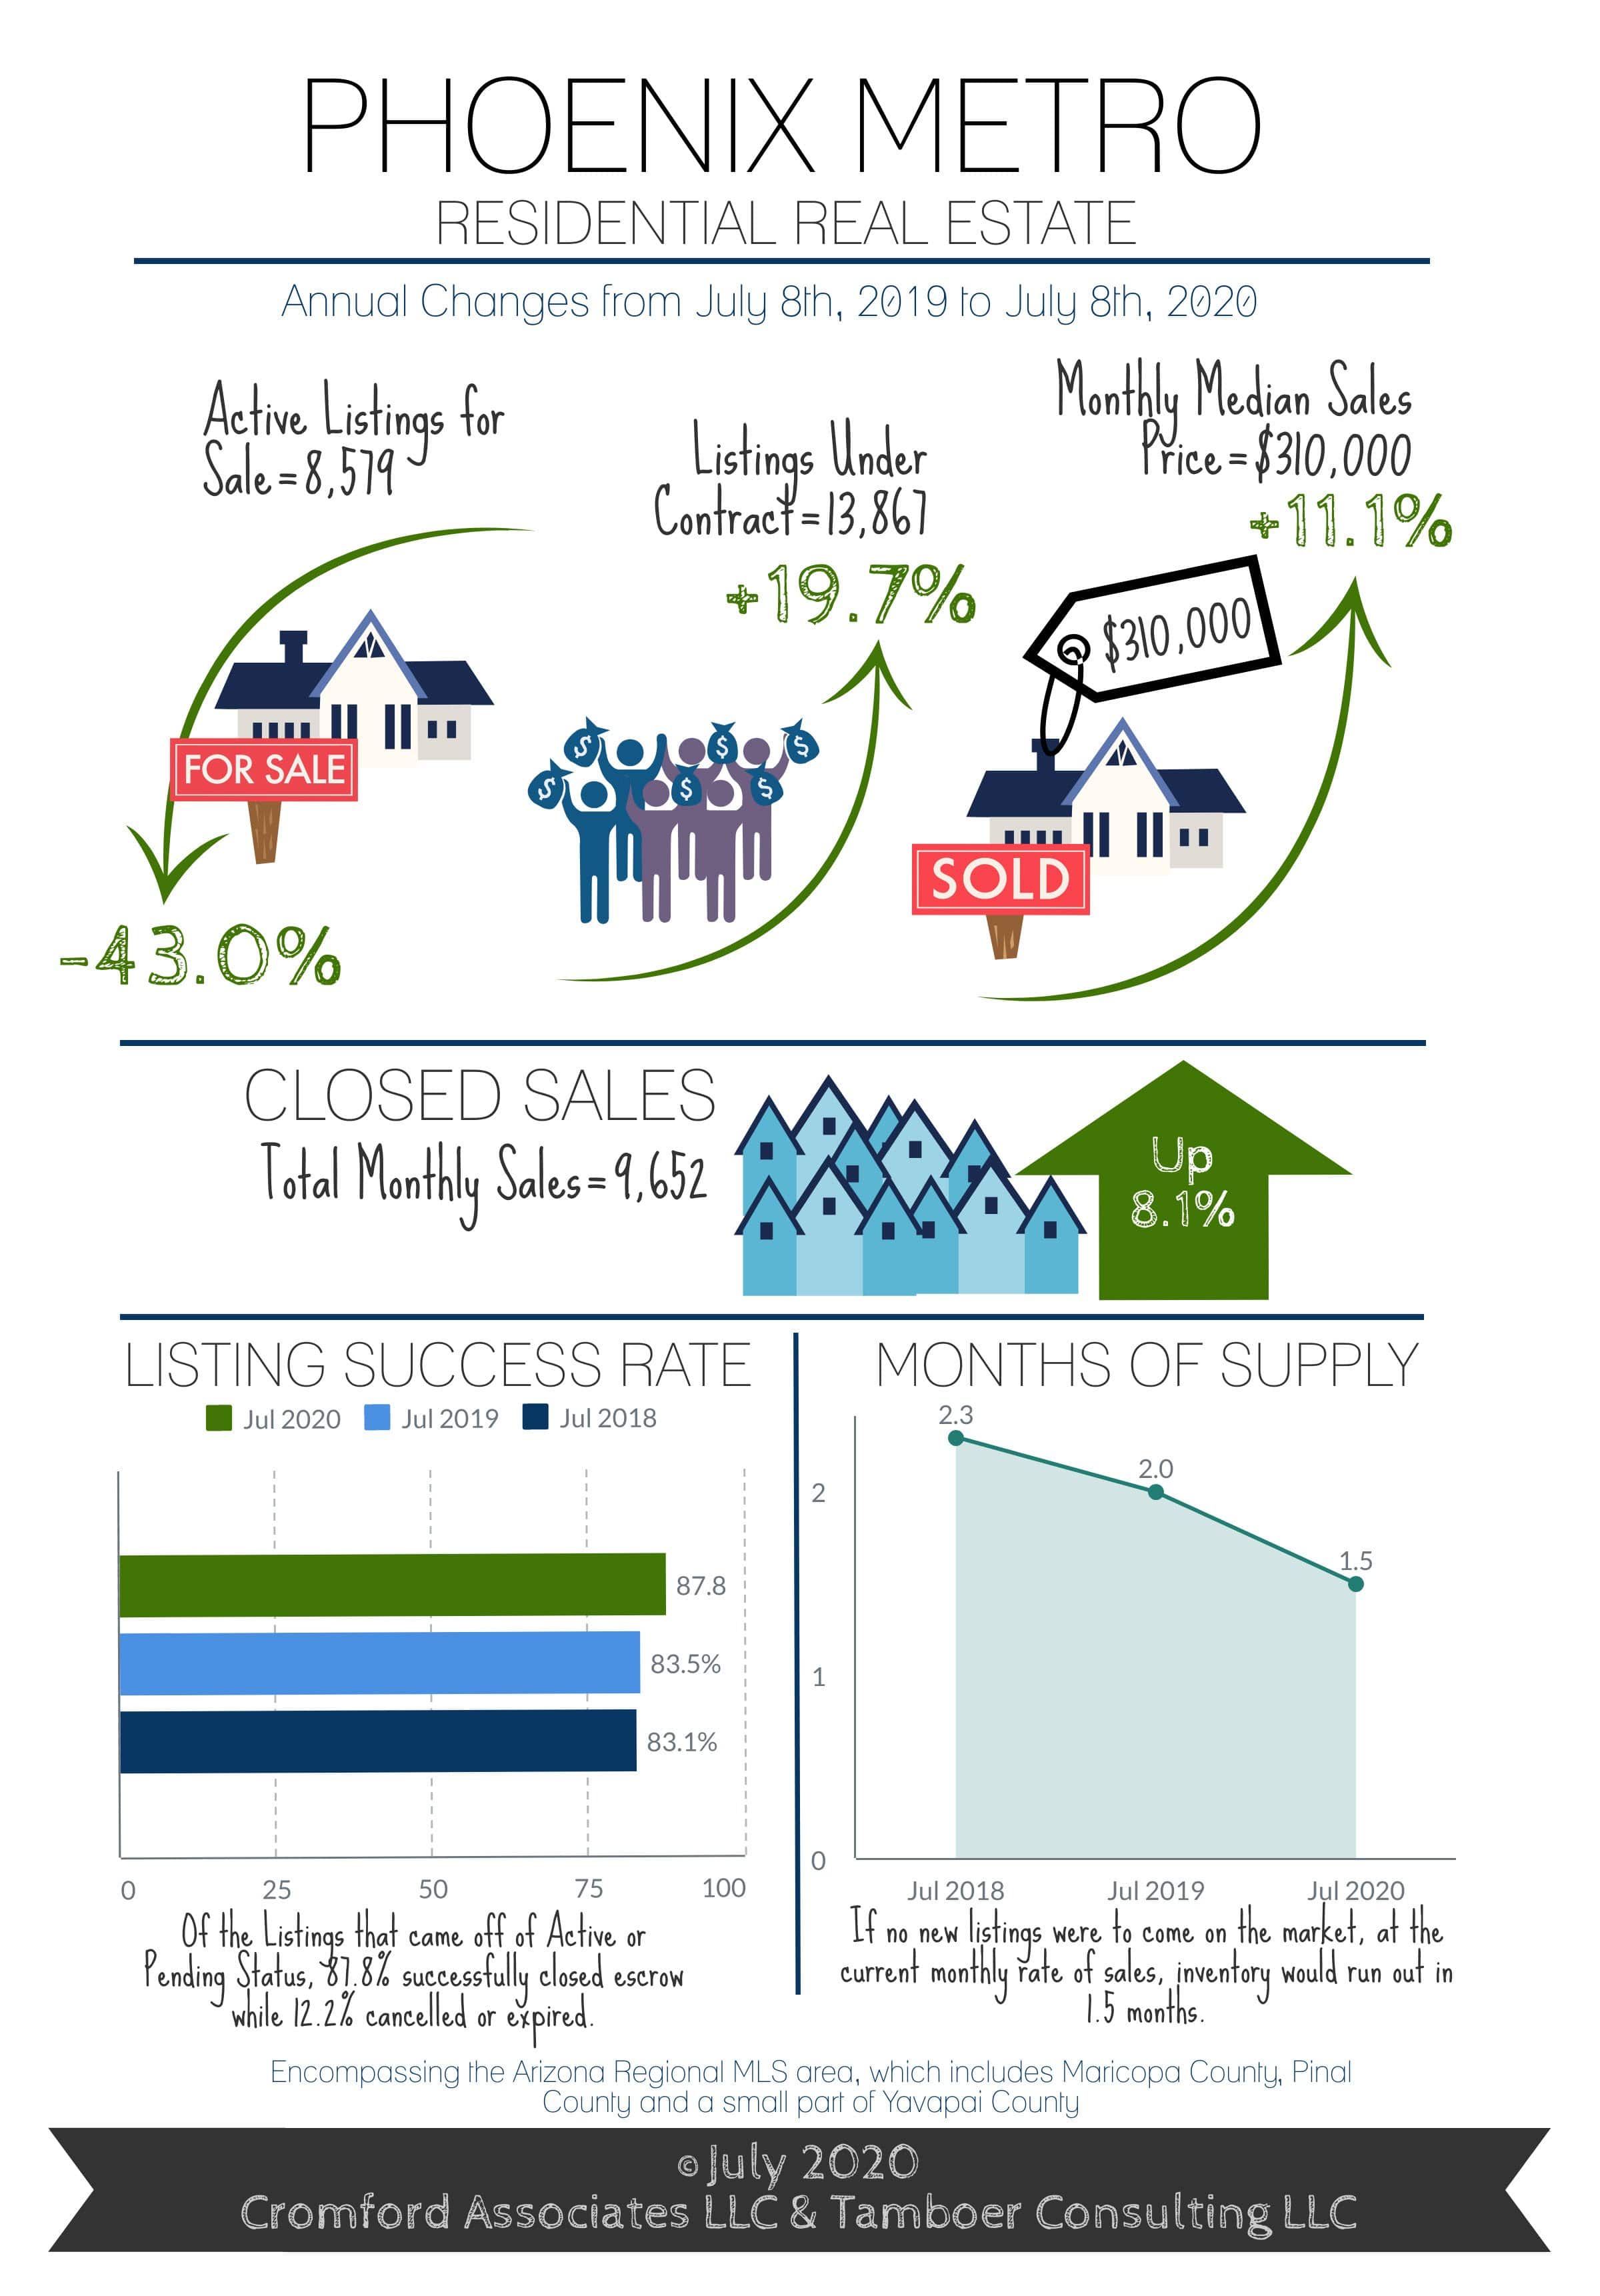
Greater Phoenix has a population of approximately 4.8 million people and 1.4 million single family homes, condos and townhomes in total inventory. As of July 8th, only 8,579 of these units were available for sale through the Arizona Regional MLS. If that number doesn’t cause you to gasp, then this might: only 1,023 are single family homes under $300,000 and that number is diminishing every day. The last month has seen a surge of buyer activity, but it was not met with an equivalent surge of new listings. New listings overall compared to last year were down 7.8% while contracts in escrow soared 24% higher. For buyers under $300K however, new listings were down 22% in June compared to last year and are down 38% so far in July. This is causing an extreme amount of buyer competition in this price range. When buyers expand to over $300K, then new home construction starts supplementing inventory and providing some much needed alternatives. The top 3 cities for single family home permits are Phoenix, Mesa and Buckeye with notable spikes in building permits issued in Surprise, Maricopa and Queen Creek. Most new homes are selling between $300K-$500K, but buyers looking for a brand new single family home under $300K still have some options. Their best bet is in Pinal County or Buckeye with average sizes between 1,800-2,000 square feet for their budget. Conversely, new listings over $500K saw a spike last month, up 20% over last year. 1,596 new listing came on the market and 2,046 contracts were accepted in this price range in June.
For Sellers:
Brace yourselves. Half of the sellers who accepted contracts under $400K in the first week of July were on the market for just 8 days or less with their agent prior to contract acceptance. Sellers who took contracts between $400K-$600K had a median of 14 days on the market with their agent and those who landed contracts between $600K-$1M had a median of 41 days. It’s a good time to be a seller. While 28% of all sales in July so far have closed over asking price, that percentage peaks at 41% for those between $200K-$300K. Top cities for closings over asking price are Tolleson, Avondale, Glendale, Gilbert and Youngtown. Gilbert is the only city in that list with a median sale price over $300K. Seller-assisted closing costs remain popular and were involved in 23% of all sales in the first week of July. That percentage increases to 33% on transactions closed between $150K-$300K. Top areas where 50%-60% of sales involved seller accepted closing cost assistance were Youngtown, West Phoenix, Aguila, Glendale, and Tolleson. This supports the theory that sellers receiving offers over asking price in the West Valley and other affordable areas are still open to accepting closing cost assistance if a contract meets their most important needs.
©2020 Cromford Associates LLC and Tamboer Consulting LLC


