Market Summary for the Beginning of September Courtesy of Cromford Report
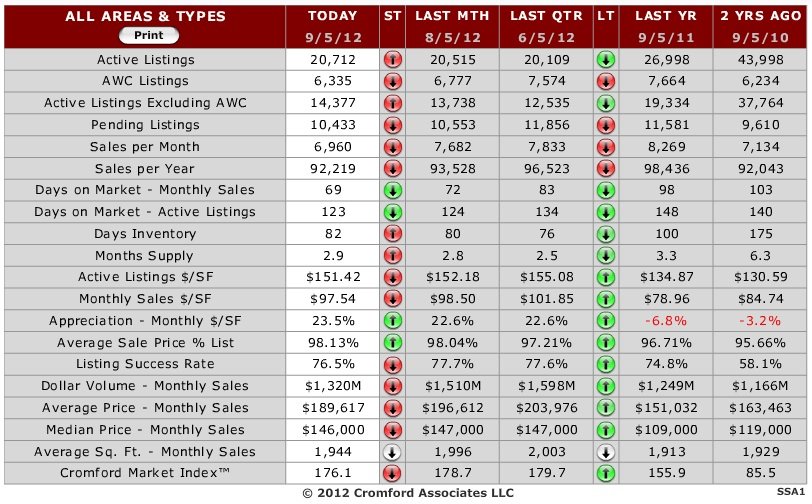
During August we continued the market’s three month wind-down following its springtime frenzy. The basic numbers for September 1, 2012 relative to September 1, 2011 for all areas & types across ARMLS are:
- Active Listings (excluding AWC): 14,405 versus 19,216 last year – down 25% – and up 7% from last month
- Active Listings (including AWC): 20,678 versus 26,820 last year – down 23% – and up 3% from last month
- Pending Listings: 10,125 versus 11,508 last year – down 12% – and down 3% from last month
- Monthly Sales: 7,573 versus 8,470 last year – down 11% – and up 3% from last month
- Monthly Average Sales Price per Sq. Ft.: $97.45 versus $79.64 last year – up 23% – and down 0.7% from last month
- Monthly Median Sales Price: $145,700 versus $109,900 last year – up 33% – and up 0.6% from last month
Pricing
Nothing very impressive there, assuming we have all got used to the idea that average price per sq. ft. for sales is up 23%. The luxury market has had it’s usual quiet summer which means pricing has taken 3 steps back having taken 26 steps forward between September 2011 and June 2012. It’s all rather boring and predictable.
Overall average prices have been in decline from June 18 to September 3, and if we look at the overall average price per sq. ft. for the last 6 months, we also see a decline from June 18 onwards.
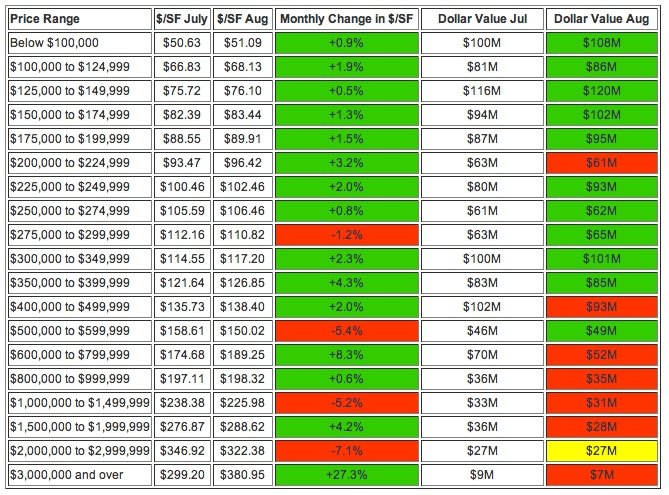
However if we look at single family detached homes within Greater Phoenix and divide the sales into list price ranges, we see a rather more complex picture.
Here we see most of the price ranges continuing to increase in price per sq. ft. between July and August. There are 4 exceptions – $275,000 to $299,999, $500,000 to $599,999, $1,000,000 to $1,499,999 and $2,000,000 to $2,999,999.
The dollar volume determines how much of an influence that price range has on the overall market averages. Note however that dollar volume grew in almost all the ranges up to $399,999, but declined in most of the ranges over $400,000. This change in dollar volume mix in favor of lower priced homes is the dominant factor that has caused the recent decline in overall price averages and $/SF. This is a common seasonal effect. Luxury homes tend to lose market share every August. That trend usually reverses during the following 8 weeks.
Sales by Type
Greater Phoenix REO sales are once again below 14% of the monthly total. At their peak on February 11, 2009, they constituted 71.1% of monthly sales. Although it will take some time for them to disappear completely, REOs are no longer a major factor in the market.
In contrast, short sales comprised 30.4% of all sales in Greater Phoenix in August. almost equal to the 30.3% we now measure for July 2012.
Normal sales have risen from 55.3% to 56.1% of sales and their pricing is down from $114.76 to $113.07 per sq. ft. Pricing for normal sales peaked at $120.72 on June 16 and has fallen back 6.3% since then. This is a natural consequence of weaker sales at the top end of the market.
Supply
Supply continues to increase gently, in line with seasonal patterns, though supply is increasing much faster in locations like Queen Creek and Maricopa. In contrast the luxury market areas have seen supply declining or steady. Overall we still have nowhere near enough supply for a housing market the size of Greater Phoenix.
Pending Listings Pricing
Last month we suggested that we should watch the average $/SF for under contract listings to look for signs of the next big move in pricing. Those signs started appearing immediately after we wrote those words. Although we have no trace of upward trend in sales pricing, since August 4, we have been watching a sharp move upwards for listings under contract. We therefore expect to see a mild increase in sales pricing for the next two weeks followed by a more impressive move upwards during the second half of September.
Foreclosures
To make up for the relative lack of exciting news in sales data, the foreclosure numbers have had an eventful August. For this we have to thank Bank of America and their trustee subsidiary Recontrust. Up until July 27, Bank of America was behaving much like any other lender and allowing roughly 60% of its trustee sales to be purchased by third parties. From July 30 onwards, there was clearly a policy change. Bank of America has both stepped up its rate of foreclosure and set its opening credit bids very high, ensuring that the vast majority of trustee sales result in a property reverting to the beneficiary – i.e. Bank of America.
Those looking for bad news to celebrate can rejoice in the increased rate of completed foreclosures, but from our perspective this has no real long term significance. It is just reducing the pool of pending foreclosures much faster than in the first 7 months of 2012, and eliminating delinquent loans faster than they are arising. This is because the new notices of trustee sales are down from 3,389 to 3,344. This looks like a small decline at first sight, but remember that August had 2 extra working days over July so the daily rate declined more than 10%. It seems that Bank of America has realized that with REOs easy to sell and prices rising, taking them into inventory is not such a bad idea. At least it allows them to steer the properties towards ordinary home buyers rather than investors. Ordinary home buyers are more likely to require home loans too. At present no other lenders seem to have followed suit. However Bank of America represents some 25% of the foreclosure pipeline and investors on the courthouse steps are no doubt dismayed by the reduction in buying opportunities.
The result will be a small increase in REO inventory (about 15%), probably followed by a small increase in REOs for sale through ARMLS (also about 15%). This will be popular with listing agents who handle Bank of America REOs and buyers looking for bargains. Do not get too excited however. No doubt there will be at least 10 offers for most of properties listed.
Looking Forward
In September our list of things to watch includes:
- will the $/SF for under contract listings continue its sharp rise?
- when will the $/SF for closed sales follow suit?
- will Bank of America and Recontrust continue their new policy of acquiring far more REOs from trustee sales?
- will any other lenders follow their example?
The short supply will probably feel slightly less of an issue during the rest of the year when demand is relatively low, but if we enter next year’s spring buying season with our current level of supply, we are likely to see fireworks again between February and May. It will be interesting to see how much the new home builders are able to gear up for this opportunity. If they can increase capacity this might put more homes into the supply and limit the upward pricing pressure. However they currently face a constrained supply of vacant lots under developer ownership and very limited number of trained and available tradespeople in most of the key construction disciplines.
After a relatively quiet summer spell, the next 9 months are going to be very interesting to follow.


